
This post is to discuss the tech stack used to power the Pinalytics site. This page represents Version 1.0.
Why Pinalytics?
I play competitive pinball, and I love data. Pinball tournaments and leagues generate data points related to players, locations, and event results where certain insights can be drawn out. Tim Sexton from Stern Pinball had created the Pinball Statistics Power Rankings which focused on individual player performance which I took inspiration from for this project, but the focus for this project is a macro level for the overall “strength” of a region.
I also created Pinalytics to make a project that uses dbt. What the heck is dbt? dbt (“data build tool”), is:
a development framework that combines modular SQL with software engineering best practices to make data transformation reliable, fast, and fun.
– dbt’s website
So what are the problems that you’re trying to solve?
- Compile Relevant Player and Tournament Data
- Classify Players and Tournaments into interesting cohorts
- Add an extra layer to US Geography; instead of just using State lines we tie the ZIP Codes to a Designated Marketing Area centered around urban areas.
- Capture main metrics for an area for a rolling 48 month basis, which matches the time for which an event value counts towards ranking
Cut to the Chase. What’s the Stack?
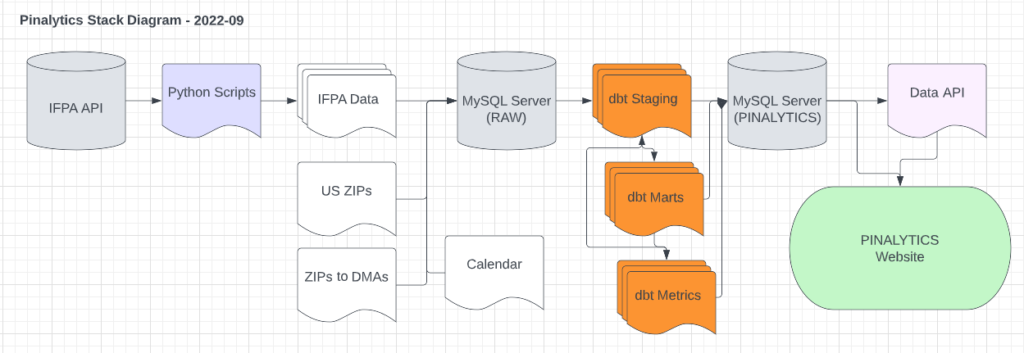
- Python – to extract data from the IFPA website
- Excel – Manipulate the flat files needed as additional sources
- MySQL – Database storage (version 5.7.38) that is compatible with my current hosting service
- dbt – Data Warehousing – GitHub Link
- Python – A basic Data API for the use of front end
- Website – PHP driven
Data Sources
IFPA Tournament Data
The IFPA (International Flipper Pinball Association) is the governing body supporting competitive pinball events. They have an API which gives relevant information about:
- Players
- Tournaments
- Tournament Results
Calendar – A basic seed file was generated to allow calendar roll-ups across different vectors.
ZIP Codes – Basic ZIP code data for the United States
ZIP to DMA Mappings – DMAs are “Designated Marketing Areas”. You can see an interactive map of the Designated Marketing Areas here. They are highly tied to media and television markets.
Why DMAs? This is to help break state lines and align a ZIP code to a more natural association based on the region.
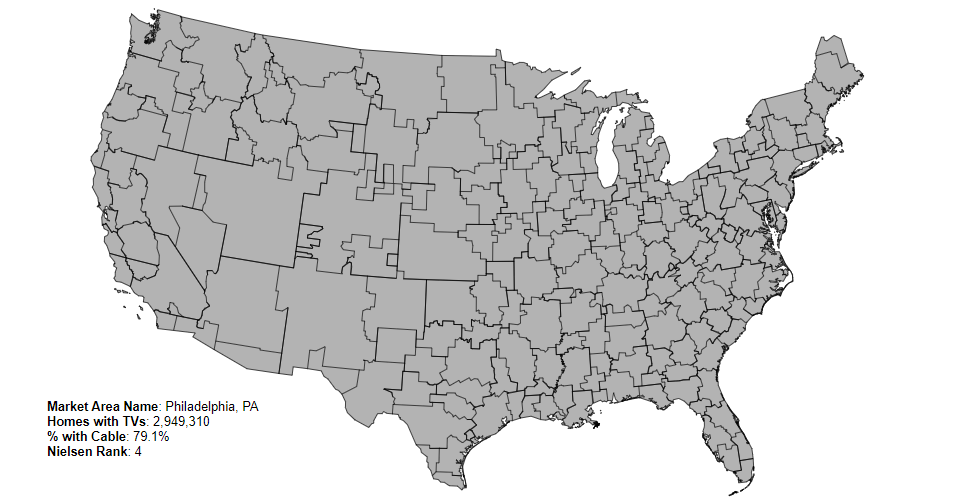
For example, I live near Philadelphia, PA. Pennsylvania has a number of thriving pinball scenes (across five different DMAs), but for me in Philadelphia it’s very hard to make a day trip to Pittsburgh (300mi, 482 km) for an event.
The goal of tying to a DMA is to look at the strength of a region and not just a state. Currently, it’s easy enough to look at a State or Province via the IFPA site to see the standings for the yearly North American Championships. But that doesn’t tell the whole story. DMAs allow us (for the US) to go a level deeper and find out what’s happening in different regions. Here’s a map of Pennsylvania, which includes DMAs from:
- Buffalo, NY
- Elmira, NY
- Erie, PA
- Harrisburg/Lancaster/Lebanon/York, PA
- Johnstown/Altoona, PA
- Philadelphia, PA
- Washington, DC
- Wilkes Barre/Scranton, PA
- Youngstown, OH

Python Scripting
If you want good data and analytics, then you have to have the right data to begin with. The stack has some very basic Python scripts that iterate through player, tournaments, and results APIs and dump out the results in a structured CSV format.
The scripts included time requests json csv math and datetime
These would be run once a month to grab the latest dataset. A full refresh is required to make sure you have the latest and greatest, specifically for recently-created events or events where there was a change after the initial publication or results.
Future improvements will likely include:
- Better extraction for incremental updates
- Changes to the code to speed up the monthly extraction process which is currently very linear
- Publish the GitHub Repo to make it public (needs some cleanup)
MySQL Database – RAW Schema
My current web hosting utilizes MySQL 5.7. Is the the latest and greatest? No, but it gets the job done. It’s also the database stack I have the most familiarity with from building other websites. I explored the possibility of using Postgres given it’s natural compatibility with dbt, but at the end I settled with something that I had more familiarity with to make the front-end build easier.
Using a mix of a local development environment, MySQL Workbench, and opening up the necessary IP addresses, we’re finally ready to rock and roll with dbt development.
dbt
Here’s where the fun begins. dbt allows us to take the raw data inputs and use modular SQL files to cleanse, enhance, and produce analytics outputs that can be consumed by the front end.
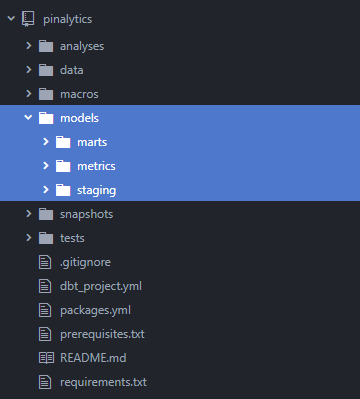
dbt contains starter templates for project initialization, which is where the codebase started.
In thinking about the flow of the data:
- Sources and Seeds -> There’s six main source tables in both database and flat-file formats and this is where it all starts.
- Staging -> Raw files come in, cleansed files come out. This stage is used to get rid of bad lines of data and start to enhance the outputs.
- Marts -> I’m very much a believer in Kimball Modeling, and I love taking the concepts of dimensionality and facts to make sure the the marts layer is a clean output where the grain is simple, clean, and testable. I view Marts as a “Grand Central Station” concept where all data must pass through before moving onto the next layer.
- Metrics -> This is the “final” layer of the dbt stack. The goal of the metrics layer is to have data products ready to go to be consumed by applications or people who need it.
- Exposures -> Connections to where the data products are going.
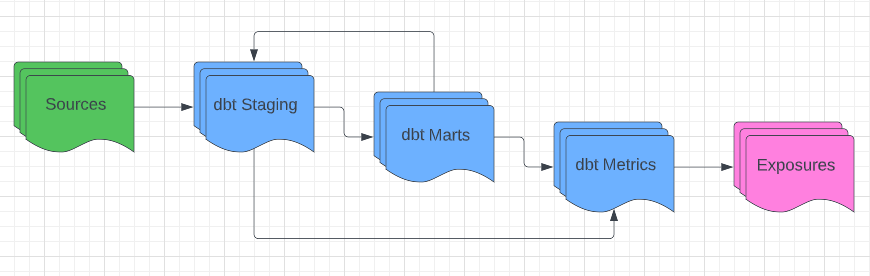
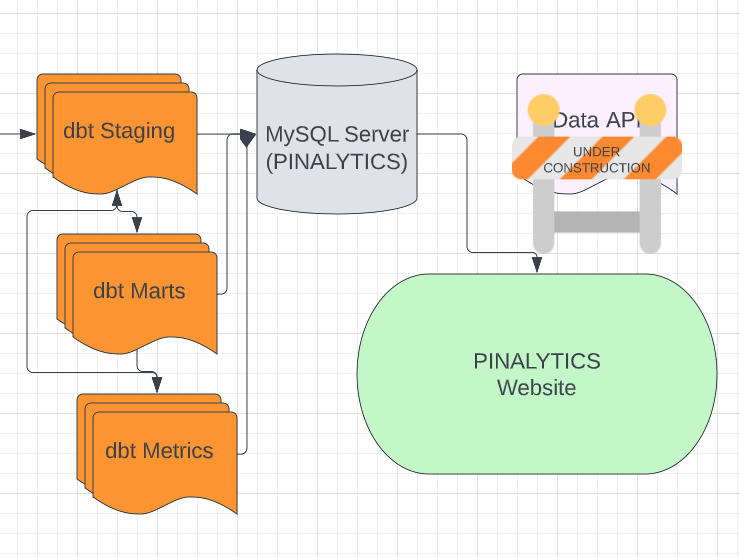
In thinking about the DAG (Directed Acyclic Graph), in an ideal state your DAG would look simple and wonderful and something like this:
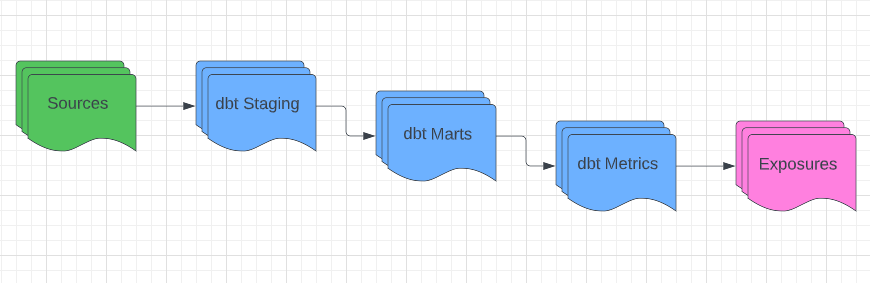
But in reality, things are of course messier and more complicated.
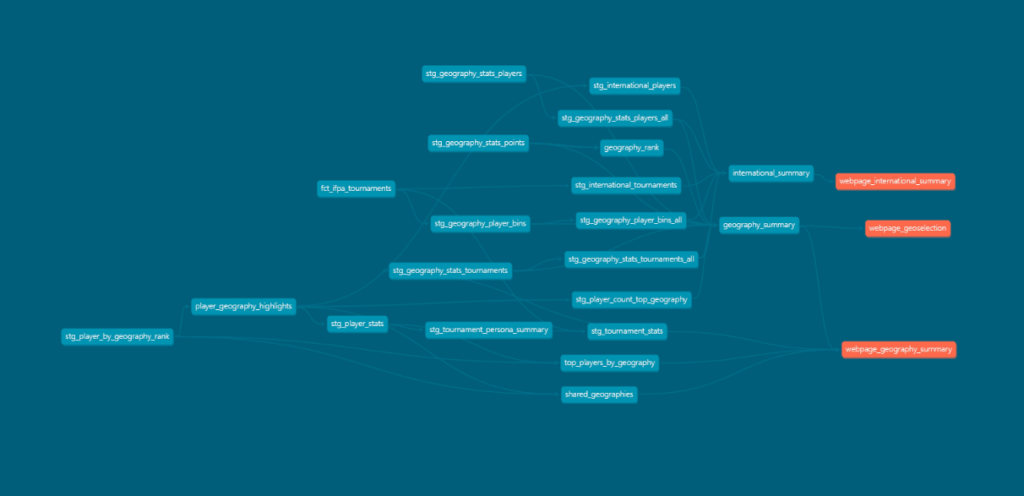
And that’s OK! In the case of this project, there’s work that goes into producing the Marts layer, which then has to be spun further with additional Staging models in order to make it to the Metrics layer.
Here’s a very zoomed-out view of what results in the DAG for this project. The red circles represent the Marts layer…which then continues on to a bunch more Staging files before we get to the Metrics layer.

Should we separate out the “Staging for Marts” and “Staging for Metrics” concept in a future version? Perhaps! For now, we’ll call this a “good enough” for this first iteration.
So, how’s that MySQL choice working out from a dbt perspective? Pretty good! But, some lessons learned along the way.
- MySQL isn’t a dbt verified adapter! However, it is a community-maintained adapter created by dbeatty10.
- The MySQL server that my hosting company uses seems very underpowered. I started by doing development directly against it, but started running into time-out and connection errors which is why I ended up installing a local MySQL environment.
- MySQL 5.7 doesn’t have CTEs. It does support subqueries, but because of the performance issues I was facing early on, I decided to:
- Break out what would normally be a CTE into a Staging model
- Materialize the Staging models
- Also, MySQL is (understandably) a lot more persnickety than a data warehouse like Snowflake in terms of Primary Key and Index definitions, so thought needed to go into each model in terms of “what’s the key here and what is the model going to have to reference?”.
As a result, I learned a lot about pre-hooks and post-hooks and the proper way to make them work in a MySQL environment. Example Below:
{{
  config({
    "post-hook": 'ALTER TABLE {{ target.schema }}.{{ this.name }}
                      add PRIMARY KEY(tournament_id)
                    , add INDEX index_city_state (city_state(255))
                    , add INDEX index_date (date)'
    })
}}
dbt Testing
dbt Testing helps with automated testing. The project here is relatively simple and I thought we’d have some straight-ahead tests that would easily pass:
- Unique
- Not Null
Well, it turns out I had a problem somewhere in the tournament_results model on the unique key!
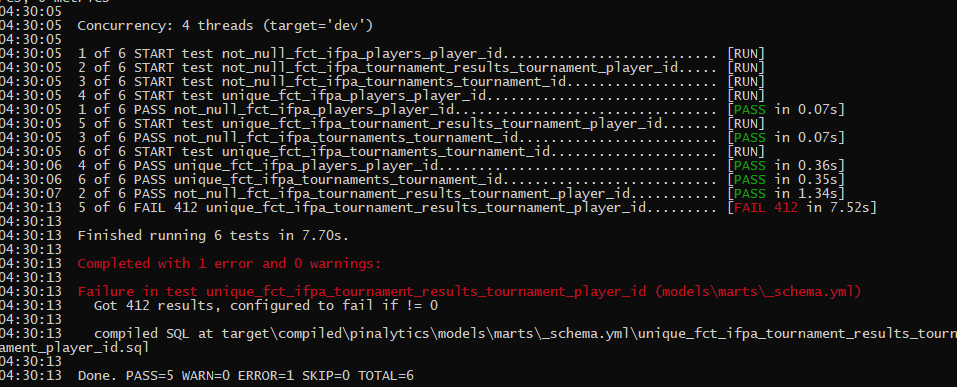
There tournament results that weren’t keyed to a specific player because of player-suppression rules, so we have results that don’t have a player associated with them. They’re still valid data points, so the key was changed to ensure we kept the integrity of the table.
At the end of it all, we have our main Mart tables:
- fct_ifpa_players
- fct_ifpa_tournaments
- fct_ifpa_tournament_results
…which then get spun into different Metrics models for front-end Consumption, like
- international_summary
- geography_summary
- top_players_by_geography
…which those can be connected to Exposures to represent the data products being used downstream
Python – A basic Data API for the use of front end
Now that we have the data sorted and formatted the way we want for the application layer we need a way to get that data to the application.
Ideally we want it to look like this:
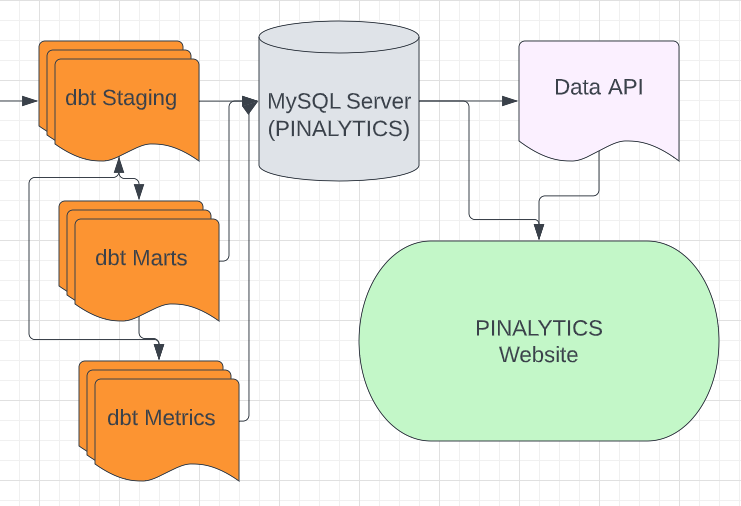
Why? Because then we can centrally control (and store) the various SQL queries to served up in a programmatic way for the web application, specifically for the charts. We can also store those queries in dbt making maintenance simpler.
In really though, here’s where it’s at:
Thanks to my friend Ryan Weicker who is leading the way with a basic Python/Flask application which will maintain the connection to the database and serve up the data in digestible CSVs. It’ll be used specifically for making charts. For now though, it’s a lot of on-the-fly manipulation of queries to get the outputs in the format needed.
Website
The website is a basic PHP site, with the following plugins and add-ons:
- CSS Framework is Skeleton
- Chart.js is used for the charts. I tried out D3.js but it ended up being more complicated than what I needed and more complicated to implement.
- select2 is being used for the interactive dropdowns
What’s Next?
We’re to the point where basics are in place across the board to be able to make incremental updates over time. Right now the plan is to keep the data feed flowing the next few months as individual months roll along.
Potential Version 2 enhancements might include:
- Additional geography breakouts. Right now it’s only broken out for US Metro areas. I tried to find a Canadian breakout but the best I could find was this breakout but couldn’t find any connection to Postcode. The concept could be expanded to other areas, but I need other expertise.
- Additional metric sets. What are other good metrics for this data set? This is where I’ll presume the pinball community will chime in. Ideas I have are things like engagement scores of players based on how frequently they play, or “customer cohorts” based on how long they’ve been an active player for.
- Additional dimensionality and attributes. Right now the grouping of things like tournaments have been simple. But there’s more around event formats, Tournament Directors, or event text analysis of event descriptions.
- Additional datasets. Right now the data is just focused on the some of core items available, but there’s more to potentially do around integrating other sets like data from the MatchPlay.events API or the NeverDrains universe.
- Finish the API layer. This will make building future graphs easier, but it’ll also open the possibility to share the API out with others so that they can build their own applications or data analysis on top.
Have any feedback? Drop me a note at pinballspinner@gmail.com.